Drawlib Visual Reporter & 7-Chapter Blueprints
Rather than asking an LLM to sort tables or invent document layouts from scratch, pni501 deterministically enriches, deduplicates, and pre-sorts every diagnostic metric into a cached 7-chapter ReportBlueprint (blueprint.py and migration_blueprint.py) before compiler.py compiles vector A4 PDFs (reports/<target>.pdf) and multi-format deliverables via drawlib.
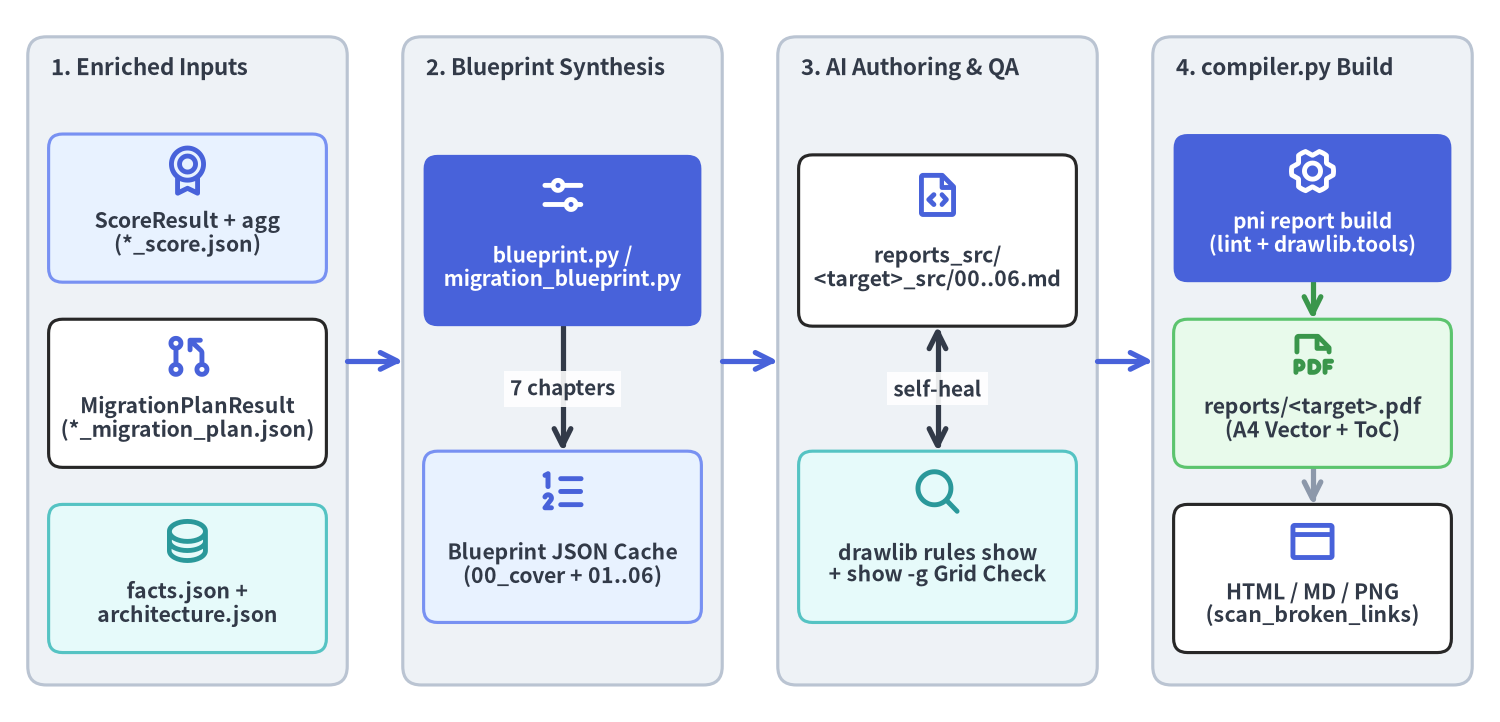
Source Code
from drawlib.canvas import save, setup
from drawlib.diagrams.architecture import ArchitectureDiagram, Node, NodeGroup, PhosphorIcon
from drawlib.styles import Styles

setup(width=162, height=78, dpi=150)

diag = ArchitectureDiagram(
    node_style=Styles.PrimaryBold,
    node_text_style=Styles.DarkBold.patch(text_size=10.2),
    edge_style=Styles.DarkBold,
    edge_text_style=Styles.DarkBold.patch(text_size=10.0),
    node_card_style=Styles.WhiteBordered.patch(shape_r=1.5),
)

g_inputs = diag.add(
    NodeGroup(
        title="1. Enriched Inputs",
        width=34.5,
        height=70.0,
        style=Styles.Neutral.patch(shape_r=2.0),
        text_style=Styles.DarkBold.patch(text_size=10.8, halign="left", valign="top"),
    ),
    xy=(3.0, 4.0),
)
n_score = g_inputs.add(
    Node(
        "ScoreResult + agg\n(*_score.json)",
        width=30.0,
        height=16.0,
        icon=PhosphorIcon.MEDAL,
        icon_size=5.4,
        card_style=Styles.PrimaryNeutral.patch(shape_r=1.5),
    ),
    xy=(17.25, 51.5),
)
n_plan = g_inputs.add(
    Node(
        "MigrationPlanResult\n(*_migration_plan.json)",
        width=30.0,
        height=16.0,
        icon=PhosphorIcon.GIT_PULL_REQUEST,
        icon_size=5.4,
    ),
    xy=(17.25, 31.5),
)
n_cache = g_inputs.add(
    Node(
        "facts.json +\narchitecture.json",
        width=30.0,
        height=16.0,
        icon=PhosphorIcon.DATABASE,
        icon_size=5.4,
        style=Styles.SecondaryBold,
        card_style=Styles.SecondaryNeutral.patch(shape_r=1.5),
    ),
    xy=(17.25, 11.5),
)

g_bp = diag.add(
    NodeGroup(
        title="2. Blueprint Synthesis",
        width=34.5,
        height=70.0,
        style=Styles.Neutral.patch(shape_r=2.0),
        text_style=Styles.DarkBold.patch(text_size=10.8, halign="left", valign="top"),
    ),
    xy=(43.5, 4.0),
)
n_bp_eng = g_bp.add(
    Node(
        "blueprint.py /\nmigration_blueprint.py",
        width=30.0,
        height=18.5,
        icon=PhosphorIcon.SLIDERS_HORIZONTAL,
        icon_size=5.6,
        style=Styles.WhiteBold,
        text_style=Styles.WhiteBold.patch(text_size=10.0),
        card_style=Styles.PrimaryFlat.patch(shape_r=1.5),
    ),
    xy=(17.25, 48.0),
)
n_bp_json = g_bp.add(
    Node(
        "Blueprint JSON Cache\n(00_cover + 01..06)",
        width=30.0,
        height=18.5,
        icon=PhosphorIcon.LIST_NUMBERS,
        icon_size=5.6,
        card_style=Styles.PrimaryNeutral.patch(shape_r=1.5),
    ),
    xy=(17.25, 16.0),
)

g_author = diag.add(
    NodeGroup(
        title="3. AI Authoring & QA",
        width=34.5,
        height=70.0,
        style=Styles.Neutral.patch(shape_r=2.0),
        text_style=Styles.DarkBold.patch(text_size=10.8, halign="left", valign="top"),
    ),
    xy=(84.0, 4.0),
)
n_src = g_author.add(
    Node(
        "reports_src/\n<target>_src/00..06.md",
        width=30.0,
        height=18.5,
        icon=PhosphorIcon.FILE_CODE,
        icon_size=5.6,
    ),
    xy=(17.25, 48.0),
)
n_qa = g_author.add(
    Node(
        "drawlib rules show\n+ show -g Grid Check",
        width=30.0,
        height=18.5,
        icon=PhosphorIcon.MAGNIFYING_GLASS,
        icon_size=5.6,
        style=Styles.SecondaryBold,
        card_style=Styles.SecondaryNeutral.patch(shape_r=1.5),
    ),
    xy=(17.25, 16.0),
)

g_compile = diag.add(
    NodeGroup(
        title="4. compiler.py Build",
        width=34.5,
        height=70.0,
        style=Styles.Neutral.patch(shape_r=2.0),
        text_style=Styles.DarkBold.patch(text_size=10.8, halign="left", valign="top"),
    ),
    xy=(124.5, 4.0),
)
n_comp = g_compile.add(
    Node(
        "pni report build\n(lint + drawlib.tools)",
        width=30.0,
        height=16.0,
        icon=PhosphorIcon.GEAR_SIX,
        icon_size=5.4,
        style=Styles.WhiteBold,
        text_style=Styles.WhiteBold.patch(text_size=10.0),
        card_style=Styles.PrimaryFlat.patch(shape_r=1.5),
    ),
    xy=(17.25, 51.5),
)
n_pdf = g_compile.add(
    Node(
        "reports/<target>.pdf\n(A4 Vector + ToC)",
        width=30.0,
        height=16.0,
        icon=PhosphorIcon.FILE_PDF,
        icon_size=5.4,
        style=Styles.SuccessBold,
        card_style=Styles.SuccessNeutral.patch(shape_r=1.5),
    ),
    xy=(17.25, 31.5),
)
n_opt = g_compile.add(
    Node(
        "HTML / MD / PNG\n(scan_broken_links)",
        width=30.0,
        height=16.0,
        icon=PhosphorIcon.BROWSER,
        icon_size=5.4,
    ),
    xy=(17.25, 11.5),
)

diag.connect(n_bp_eng, n_bp_json, label="7 chapters", routing="orthogonal")
diag.connect(n_qa, n_src, label="self-heal", arrow="<->", routing="orthogonal")
diag.connect(n_comp, n_pdf, routing="orthogonal", style=Styles.SuccessBold)
diag.connect(n_pdf, n_opt, routing="orthogonal", style=Styles.MutedBold)

diag.connect(g_inputs, g_bp, routing="orthogonal", style=Styles.PrimaryBold)
diag.connect(g_bp, g_author, routing="orthogonal", style=Styles.PrimaryBold)
diag.connect(g_author, g_compile, routing="orthogonal", style=Styles.PrimaryBold)

diag.draw(xy=(0.0, 0.0))
save()
1. Why Blueprint-Driven Illustration-as-Code?
When generating executive audit deliverables or multi-phase migration specifications, unguided LLM document generation frequently suffers from dropped findings, inconsistent table ordering, and fragile chart code. pni501 eliminates these failure modes by separating deterministic blueprint synthesis from visual Markdown authoring:
- Pre-Computed Chapter Payloads (
blueprint.json/migration_blueprint.json): Duringwrite_drawlib_reportandwrite_migration_report,src/pni/_reporter/blueprint.pyandsrc/pni/_reporter/migration_blueprint.pytransform the enrichedScoreResultorMigrationPlanResultinto a 7-chapterReportBlueprintcontaining pre-sorted tables, chart series, KPI card values, and chapter-by-chapter Drawlib component recommendations. - Version-Controlled
docArchetype (reports_src/<target>_src/): Every report is scaffolded as a self-contained Drawlibdocproject (drawlib.toml,styles.py,utils.py, and<lang>/00_cover.md .. 06_*.md), keeping narrative prose and declarative Python diagrams in Git alongside the repository. - Automated Preflight Linting & Multimodal Grid Verification: Before invoking
drawlib.tools.build_pdf(),compiler.pyrunslint_drawlib_chapters()to catch missing chart legends and UML heatmap contour collisions, while agents inspect-gcoordinate-grid renders to ensure zero text clipping.
2. Dual 7-Chapter ReportBlueprint Architecture
Both health audit workflows (category: audit) and modernization workflows (category: migration) standardize on an identical 7-file linear doc layout (00_cover.md + 01..06.md), localized in English (en) or Japanese (ja). Drawlib automatically injects a hyperlinked Table of Contents immediately after 00_cover.md.
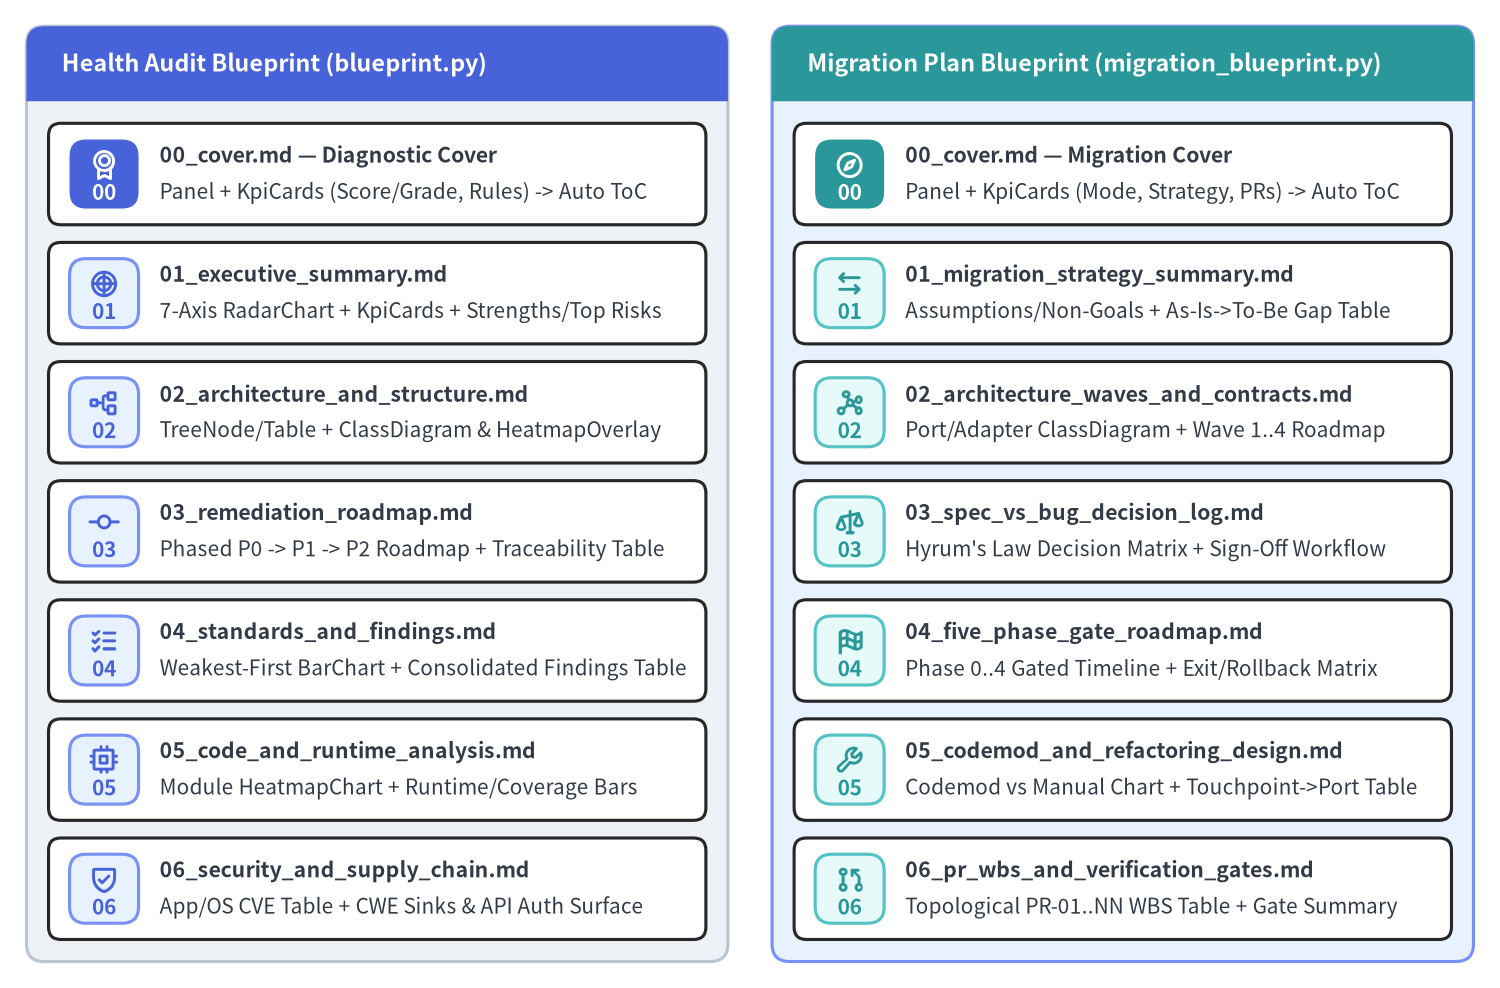
Source Code
from drawlib.canvas import save, setup
from drawlib.icons import phosphor
from drawlib.smartarts import CardList, Panel
from drawlib.styles import Styles

setup(width=170, height=112, dpi=150)

audit_panel = Panel(
    "Health Audit Blueprint (blueprint.py)",
    header_variant="filled",
    header_height=8.5,
    style=Styles.Neutral.patch(shape_r=2.0),
    header_style=Styles.PrimaryFlat,
    text_style=Styles.WhiteBold.patch(text_size=11.2),
)
audit_panel.draw(xy=(3.0, 3.0), width=79.5, height=106.0)

audit_cards = CardList(
    style=Styles.WhiteBordered.patch(shape_r=1.4),
    text_style=Styles.DarkBold.patch(text_size=10.2),
    description_style=Styles.Dark.patch(text_size=10.0),
    badge_shape="rounded_rect",
    badge_style=Styles.PrimaryNeutral,
    badge_text_style=Styles.PrimaryBold.patch(text_size=10.0),
    icon_style=Styles.PrimaryBold,
    direction="vertical",
    spacing=2.0,
)
audit_cards.add(
    "00_cover.md — Diagnostic Cover",
    "Panel + KpiCards (Score/Grade, Rules) -> Auto ToC",
    badge_text="00",
    icon=phosphor.medal,
    badge_style=Styles.PrimaryFlat,
    badge_text_style=Styles.WhiteBold.patch(text_size=10.0),
    icon_style=Styles.WhiteBold,
)
audit_cards.add(
    "01_executive_summary.md",
    "7-Axis RadarChart + KpiCards + Strengths/Top Risks",
    badge_text="01",
    icon=phosphor.chart_polar,
)
audit_cards.add(
    "02_architecture_and_structure.md",
    "TreeNode/Table + ClassDiagram & HeatmapOverlay",
    badge_text="02",
    icon=phosphor.tree_structure,
)
audit_cards.add(
    "03_remediation_roadmap.md",
    "Phased P0 -> P1 -> P2 Roadmap + Traceability Table",
    badge_text="03",
    icon=phosphor.git_commit,
)
audit_cards.add(
    "04_standards_and_findings.md",
    "Weakest-First BarChart + Consolidated Findings Table",
    badge_text="04",
    icon=phosphor.list_checks,
)
audit_cards.add(
    "05_code_and_runtime_analysis.md",
    "Module HeatmapChart + Runtime/Coverage Bars",
    badge_text="05",
    icon=phosphor.cpu,
)
audit_cards.add(
    "06_security_and_supply_chain.md",
    "App/OS CVE Table + CWE Sinks & API Auth Surface",
    badge_text="06",
    icon=phosphor.shield_check,
)
audit_cards.draw(xy=(5.5, 5.5), width=74.5, height=92.5)

mig_panel = Panel(
    "Migration Plan Blueprint (migration_blueprint.py)",
    header_variant="filled",
    header_height=8.5,
    style=Styles.PrimaryNeutral.patch(shape_r=2.0),
    header_style=Styles.SecondaryFlat,
    text_style=Styles.WhiteBold.patch(text_size=11.2),
)
mig_panel.draw(xy=(87.5, 3.0), width=79.5, height=106.0)

mig_cards = CardList(
    style=Styles.WhiteBordered.patch(shape_r=1.4),
    text_style=Styles.DarkBold.patch(text_size=10.2),
    description_style=Styles.Dark.patch(text_size=10.0),
    badge_shape="rounded_rect",
    badge_style=Styles.SecondaryNeutral,
    badge_text_style=Styles.SecondaryBold.patch(text_size=10.0),
    icon_style=Styles.SecondaryBold,
    direction="vertical",
    spacing=2.0,
)
mig_cards.add(
    "00_cover.md — Migration Cover",
    "Panel + KpiCards (Mode, Strategy, PRs) -> Auto ToC",
    badge_text="00",
    icon=phosphor.compass,
    badge_style=Styles.SecondaryFlat,
    badge_text_style=Styles.WhiteBold.patch(text_size=10.0),
    icon_style=Styles.WhiteBold,
)
mig_cards.add(
    "01_migration_strategy_summary.md",
    "Assumptions/Non-Goals + As-Is->To-Be Gap Table",
    badge_text="01",
    icon=phosphor.arrows_left_right,
)
mig_cards.add(
    "02_architecture_waves_and_contracts.md",
    "Port/Adapter ClassDiagram + Wave 1..4 Roadmap",
    badge_text="02",
    icon=phosphor.graph,
)
mig_cards.add(
    "03_spec_vs_bug_decision_log.md",
    "Hyrum's Law Decision Matrix + Sign-Off Workflow",
    badge_text="03",
    icon=phosphor.scales,
)
mig_cards.add(
    "04_five_phase_gate_roadmap.md",
    "Phase 0..4 Gated Timeline + Exit/Rollback Matrix",
    badge_text="04",
    icon=phosphor.flag_checkered,
)
mig_cards.add(
    "05_codemod_and_refactoring_design.md",
    "Codemod vs Manual Chart + Touchpoint->Port Table",
    badge_text="05",
    icon=phosphor.wrench,
)
mig_cards.add(
    "06_pr_wbs_and_verification_gates.md",
    "Topological PR-01..NN WBS Table + Gate Summary",
    badge_text="06",
    icon=phosphor.git_pull_request,
)
mig_cards.draw(xy=(90.0, 5.5), width=74.5, height=92.5)

save()
2.1 Health Audit 7-Chapter Blueprint (blueprint.py)
src/pni/_reporter/blueprint.py maps ScoreResult, WorkflowFactsBundle, and ArchitectureRecord into seven structured chapters:
| Chapter File | Primary Blueprint Data Slice | Standard Drawlib Visual Components |
|---|---|---|
00_cover.md |
overall_score, grade, workflow_id, evaluated_at, rule compliance summary, finding counts |
Full-bleed cover Panel + draw_pni_logo() + KpiCards (followed by automatic PDF/HTML Table of Contents) |
01_executive_summary.md |
category_scores (7 axes), category_rationales, strengths, top critical/high risks, opt_outs |
7-Axis RadarChart + KpiCards + CardList / summary tables |
02_architecture_and_structure.md |
architecture_record (layers_and_modules, flows_and_state), internal_import_graph, module_hotspots |
TreeNode / Table + UML ClassDiagram paired with HeatmapOverlay(show_contour_lines=False) |
03_remediation_roadmap.md |
action_plan (P0 -> P1 -> P2 remediation items, target files, effort, linked rule IDs) |
Phased Roadmap / ChevronProcess + remediation traceability Table |
04_standards_and_findings.md |
audit_dimensions (weakest-first), rule_compliance, consolidated_findings (location-grouped) |
Weakest-first horizontal BarChart + location-consolidated findings Table |
05_code_and_runtime_analysis.md |
modules (loc, complexity, typing, docstrings, risk_score), runtime_facts (tests, coverage, smoke) |
Module quality HeatmapChart + multi-series runtime/coverage BarChart |
06_security_and_supply_chain.md |
security_facts (Trivy app/OS CVEs, secrets, IaC), dangerous_sinks, api_endpoints, pentest_facts |
App/OS CVE & CWE sink breakdown + live HTTP penetration test verdict Table |
2.2 Migration Execution Plan 7-Chapter Blueprint (migration_blueprint.py)
For modernization workflows (based_on a completed health audit run), src/pni/_reporter/migration_blueprint.py synthesizes MigrationPlanResult and MigrationFacts into a parallel 7-chapter execution blueprint:
| Chapter File | Primary Blueprint Data Slice | Standard Drawlib Visual Components |
|---|---|---|
00_cover.md |
transformation_mode, migration_strategy, api_compatibility, bug_handling_policy, PR & phase counts |
Full-bleed migration cover Panel + draw_pni_logo() + KpiCards (followed by automatic ToC) |
01_migration_strategy_summary.md |
confirmed_assumptions, non_goals, target_axes (As-Is -> To-Be stack & risk vectors) |
Strategy overview CardList + As-Is -> To-Be transformation matrix Table |
02_architecture_waves_and_contracts.md |
target_architecture (target_layers, component_mappings), refactoring_waves, cycle_cuts, implicit_contracts |
To-Be Port/Adapter ClassDiagram / ArchitectureDiagram + Wave 1..4 dependency topology |
03_spec_vs_bug_decision_log.md |
decision_log (DEC-01..NN), spec_vs_bug_candidates (Hyrum's Law quirks requiring PO sign-off) |
Decision workflow diagram + DEC-01..NN sign-off matrix Table |
04_five_phase_gate_roadmap.md |
phase_gates (Phase 0 Characterization through Phase 4 Cutover, exit criteria, rollback notes) |
5-phase gated Roadmap / GanttChart + exit & rollback criteria Table |
05_codemod_and_refactoring_design.md |
mechanical_codemods, manual_blockers, boundary_touchpoints (db, http, cache, auth ports) |
Automated codemod vs. manual refactoring BarChart + boundary touchpoint mapping Table |
06_pr_wbs_and_verification_gates.md |
pr_wbs (PR-01..NN topological pull-request tickets, depends_on_prs, verification_cmd) |
PR dependency DAG / phase breakdown + PR-01..NN work breakdown structure Table |
3. Non-Destructive Scaffolding, Preflight Linter & Grid QA
src/pni/_reporter/compiler.py and src/pni/_reporter/drawlib_guide.py enforce deterministic quality gates across scaffolding, authoring, and multi-format compilation.
3.1 Non-Destructive pni report init & On-Demand Rules
To prevent bloated system prompts during early AST and rule-interpretation steps, agents load Drawlib documentation dynamically right before authoring reports_src/<target>_src/<lang>/*.md, verify each diagram with the -g coordinate grid, and compile the final A4 vector PDF:
# 1. Non-destructively scaffold reports_src/<target>_src/ (preserves existing *.md chapters)
pni report init <target> --src-dir reports_src --lang en --style google

# 2. Query Drawlib API & component rules on-demand (never guess constructor arguments)
uv run drawlib rules show overview
uv run drawlib rules show project-doc
uv run drawlib rules show api

# 3. Stage 2 visual grid verification (-g) before full PDF compilation
uv run drawlib show reports_src/<target>_src/en/01_executive_summary.md \
  -s reports_src/<target>_src/styles.py -u reports_src/<target>_src/utils.py \
  -g -o .drawlib/scratch/exec_summary_grid.png

# 4. Run preflight linter and compile reports/<target>.pdf (default A4 vector PDF + ToC)
pni report build <target> --src-dir reports_src --output-dir reports
3.2 Preflight Visual Linter (lint_drawlib_chapters) & Link Verification
Before invoking drawlib.tools, compiler.py executes four automated verification guardrails:
- Non-Destructive Re-Scaffolding & Brand Assets (
scaffold_report_project): On initial creation,pni report initremoves starter sample files (00_cover.md,01_overview.md,02_design.md), copies official brand assets (_assets/{logo.png,logo_dark.png,favicon.png}), and injectsdraw_pni_logo()intoutils.py. When re-run on an existing report directory—even with--forceto refreshdrawlib.toml,styles.py, orutils.py—all authored<lang>/*.mdchapters are preserved intact so incremental re-audits produce cleangit diffhistories. - Multi-Series Chart Legend Check:
lint_drawlib_chapters()scans every```drawlibfence and verifies that anyBarChartorLineChartcalling.add_series(...)two or more times also calls.draw_legend(...). - UML ClassDiagram Contour &
Styles.WhiteGuards: CombiningClassDiagramwithHeatmapOverlay(..., show_contour_lines=True)or stylingClassDiagram/ClassNodewithStyles.White(which renders white text on a white fill; useStyles.Neutralinstead) triggers a preflight warning (or raisesValueErrorwhenstrict_preflight=True). - Output Normalization & Broken-Link Scanning (
_verify_links):pni report buildnormalizes<target>_<default_lang>.pdftoreports/<target>.pdf(page_break=True,generate_index=True). When-f htmlis included,_verify_links()runsdrawlib.tools.scan_broken_links()(supporting--link-check-root <dir>for multi-portal relative links) and fails closed (strict_links=True) if any broken link or missing image asset is detected.
For details on the upstream JSON schemas and deterministic hotspot scoring formulas, see 7-Axis Scoring Model, or consult Rules & CLI Reference for all pni report flags.